
Plot gallery
Build retained multi-axis figures, render them through OA’s Vulkan compositor, using current Rust and Python programs.
TuPaired source6 outputsUi
Source
| Surface | Repository path | SHA-256 |
|---|---|---|
| Rust | sdk/rs/tutorials/plot/tu_plot_gallery.rs | 8cb600b158dc9d3e |
| Python | sdk/py/tutorials/plot/tu_plot_gallery.py | 57b61acdfc6c350c |
| Presentation | sdk/asset/docs/plot/*.png | Verified per image |
Example
A figure owns layout and axes state. Each axes records semantic artists; rendering lowers the retained figure through the shared compositor and returns an oa::Image. The language switch replaces the complete checked source fragment.
1use std::f32::consts::PI;23use oa::plot::{Axes, BarStyle, FigureConfig, HeatmapStyle, LineStyle, ScatterStyle, Theme};4use oa::{Color, Engine};56// ── Style helpers ─────────────────────────────────────────────────────────────78fn line(color: Color, label: &str, width: f32, antialias_samples: u32) -> LineStyle {9 LineStyle {10 color,11 label: label.to_owned(),12 width,13 antialias_samples,14 }15}1617fn points(color: Color, label: &str, radius: f32) -> ScatterStyle {18 ScatterStyle {19 color,20 label: label.to_owned(),21 radius,22 }23}2425fn bars(color: Color, label: &str, gap: f32) -> BarStyle {26 BarStyle {27 color,28 label: label.to_owned(),29 gap,30 }31}3233fn gradient(a: Color, b: Color, t: f32) -> Color {34 let t = t.clamp(0.0, 1.0);35 Color::new(36 a.r + (b.r - a.r) * t,37 a.g + (b.g - a.g) * t,38 a.b + (b.b - a.b) * t,39 a.a + (b.a - a.a) * t,40 )41}4243// ── Named colors matching the donor palette ───────────────────────────────────4445fn accent() -> Color {46 Color::new(0.24, 0.65, 1.00, 1.0)47}48fn success() -> Color {49 Color::new(0.35, 0.82, 0.54, 1.0)50}51fn purple() -> Color {52 Color::new(0.75, 0.45, 1.00, 1.0)53}54fn cyan() -> Color {55 Color::new(0.30, 0.87, 0.89, 1.0)56}57fn warning() -> Color {58 Color::new(1.00, 0.80, 0.22, 1.0)59}60fn pink() -> Color {61 Color::new(1.00, 0.55, 0.75, 1.0)62}63fn gray() -> Color {64 Color::new(0.565, 0.565, 0.565, 1.0)65}6667// ── Individual axes builders ──────────────────────────────────────────────────6869// [oa-plot-intro-begin]70fn intro_figure() -> oa::plot::Figure {71 let mut fig = oa::plot::Figure::new(FigureConfig {72 title: "oa::plot intro".to_owned(),73 rows: 1,74 cols: 2,75 width: 1280,76 height: 560,77 h_spacing: 36,78 padding: 34,79 theme: Theme::Dark,80 ..Default::default()81 });82 fig.title("One retained figure — Rust and C++ parity");8384 let steps = [0.0f32, 1.0, 2.0, 3.0, 4.0, 5.0, 6.0, 7.0];85 let train = [1.00f32, 0.78, 0.61, 0.48, 0.37, 0.29, 0.23, 0.19];86 let validation = [1.04f32, 0.83, 0.66, 0.53, 0.43, 0.35, 0.30, 0.27];87 let ideal = [0.0f32, 0.25, 0.50, 0.75, 1.0];88 let confidence = [0.10f32, 0.30, 0.50, 0.70, 0.90];89 let accuracy = [0.08f32, 0.34, 0.47, 0.74, 0.88];9091 let curves = fig.ax(0, 0);92 curves.title("training curves");93 curves.x_label("optimizer step");94 curves.y_label("cross entropy");95 curves.limits(0.0, 7.0, 0.0, 1.1);96 curves.plot_xy(&steps, &train, line(accent(), "train", 1.6, 4));97 curves.plot_xy(&steps, &validation, line(success(), "validation", 1.6, 4));9899 let quality = fig.ax(0, 1);100 quality.title("Calibration");101 quality.x_label("confidence");102 quality.y_label("observed accuracy");103 quality.limits(0.0, 1.0, 0.0, 1.0);104 quality.plot_xy(&ideal, &ideal, line(gray(), "ideal", 1.35, 4));105 quality.scatter(&confidence, &accuracy, points(cyan(), "model", 3.5));106 fig107}108// [oa-plot-intro-end]109110fn training_plot(ax: &mut Axes) {111 let n = 72usize;112 let train: Vec<f32> = (0..n)113 .map(|i| {114 let step = i as f32;115 1.55 * (-step / 18.0).exp() + 0.035 * (step * 0.52).sin() + 0.11116 })117 .collect();118 let validation: Vec<f32> = (0..n)119 .map(|i| {120 let step = i as f32;121 1.45 * (-step / 21.0).exp() + 0.045 * (step * 0.39 + 0.8).sin() + 0.17122 })123 .collect();124 ax.title("training curves");125 ax.x_label("optimizer step");126 ax.y_label("cross entropy");127 ax.plot(&train, line(accent(), "train", 1.35, 4));128 ax.plot(&validation, line(success(), "validation", 1.35, 4));129}130131fn roc_plot(ax: &mut Axes) {132 let n = 33usize;133 let rate: Vec<f32> = (0..n).map(|i| i as f32 / (n - 1) as f32).collect();134 let vision: Vec<f32> = rate135 .iter()136 .map(|&x| (1.0 - (-4.3 * x).exp()).clamp(0.0, 1.0))137 .collect();138 let fusion: Vec<f32> = rate139 .iter()140 .map(|&x| (1.0 - (-6.7 * x).exp()).clamp(0.0, 1.0))141 .collect();142 ax.title("ROC — threshold sweep");143 ax.x_label("false positive rate");144 ax.y_label("true positive rate");145 ax.limits(0.0, 1.0, 0.0, 1.0);146 ax.plot_xy(&rate, &vision, line(cyan(), "vision AUC 0.88", 1.35, 4));147 ax.plot_xy(&rate, &fusion, line(success(), "fusion AUC 0.93", 1.35, 4));148 ax.plot_xy(&rate, &rate, line(gray(), "chance", 1.35, 4));149}150151fn precision_recall_plot(ax: &mut Axes) {152 let n = 33usize;153 let recall: Vec<f32> = (0..n).map(|i| i as f32 / (n - 1) as f32).collect();154 let vision: Vec<f32> = recall155 .iter()156 .map(|&x| (0.98 - 0.40 * x.powf(1.6) - 0.025 * (x * 5.0 * PI).sin()).clamp(0.0, 1.0))157 .collect();158 let fusion: Vec<f32> = recall159 .iter()160 .map(|&x| (0.995 - 0.27 * x.powf(2.1) - 0.015 * (x * 4.0 * PI).sin()).clamp(0.0, 1.0))161 .collect();162 ax.title("Precision-recall");163 ax.x_label("recall");164 ax.y_label("precision");165 ax.limits(0.0, 1.0, 0.0, 1.0);166 ax.plot_xy(&recall, &vision, line(purple(), "vision AP 0.84", 1.35, 4));167 ax.plot_xy(&recall, &fusion, line(pink(), "fusion AP 0.91", 1.35, 4));168}169170fn score_histogram(ax: &mut Axes) {171 let scores: Vec<f32> = (0..192usize)172 .map(|i| {173 let phase = i as f32;174 let cluster = if i % 3 == 0 { 0.28 } else { 0.74 };175 (cluster + 0.12 * (phase * 1.73).sin() + 0.045 * (phase * 0.37).cos()).clamp(0.0, 1.0)176 })177 .collect();178 ax.title("confidence distribution");179 ax.x_label("model score");180 ax.y_label("samples");181 ax.histogram(&scores, 20, bars(accent(), "validation scores", 0.20));182}183184fn calibration_scatter(ax: &mut Axes) {185 let n = 24usize;186 let confidence: Vec<f32> = (0..n).map(|i| (i as f32 + 0.5) / n as f32).collect();187 let accuracy: Vec<f32> = confidence188 .iter()189 .map(|&x| (x + 0.055 * (8.0 * PI * x).sin() - 0.025).clamp(0.0, 1.0))190 .collect();191 let ideal: Vec<f32> = confidence.clone();192 ax.title("Calibration");193 ax.x_label("confidence");194 ax.y_label("observed accuracy");195 ax.limits(0.0, 1.0, 0.0, 1.0);196 ax.plot_xy(&confidence, &ideal, line(gray(), "ideal", 1.35, 4));197 ax.scatter(&confidence, &accuracy, points(cyan(), "model", 3.5));198}199200fn throughput_bars(ax: &mut Axes) {201 let throughput = [0.42f32, 0.58, 0.71, 0.86, 0.79, 0.94];202 ax.title("normalized throughput");203 ax.x_label("kernel route");204 ax.y_label("relative peak");205 ax.limits(-0.5, 5.5, 0.0, 1.0);206 ax.bar(&throughput, bars(warning(), "device routes", 0.24));207}208209fn confusion_heatmap(ax: &mut Axes) {210 let confusion = [211 42.0f32, 2.0, 0.0, 1.0, 0.0, 3.0, 37.0, 2.0, 0.0, 1.0, 0.0, 2.0, 40.0, 3.0, 0.0, 1.0, 0.0, 2.0,212 38.0, 2.0, 0.0, 1.0, 0.0, 2.0, 43.0,213 ];214 ax.title("confusion matrix");215 ax.x_label("predicted class");216 ax.y_label("reference class");217 ax.heatmap(218 &confusion,219 5,220 5,221 HeatmapStyle {222 colormap: 1,223 auto_scale: true,224 show_grid: true,225 ..Default::default()226 },227 );228 ax.grid(false);229}230231fn wireframe(232 ax: &mut Axes,233 title: &str,234 height_fn: impl Fn(f32, f32) -> f32,235 near: Color,236 far: Color,237) {238 const LINES: i32 = 13;239 const SAMPLES: i32 = 29;240 // Row sweeps.241 for row in 0..LINES {242 let v = -1.0 + 2.0 * row as f32 / (LINES - 1) as f32;243 let mut px = vec![0.0f32; SAMPLES as usize];244 let mut py = vec![0.0f32; SAMPLES as usize];245 for col in 0..SAMPLES {246 let u = -1.0 + 2.0 * col as f32 / (SAMPLES - 1) as f32;247 let z = height_fn(u, v);248 px[col as usize] = 0.50 + 0.34 * (u - v);249 py[col as usize] = 0.58 - 0.16 * (u + v) - 0.23 * z;250 }251 let t = row as f32 / (LINES - 1) as f32;252 ax.plot_xy(&px, &py, line(gradient(far, near, t), "", 1.15, 8));253 }254 // Column sweeps.255 for col in 0..LINES {256 let u = -1.0 + 2.0 * col as f32 / (LINES - 1) as f32;257 let mut px = vec![0.0f32; SAMPLES as usize];258 let mut py = vec![0.0f32; SAMPLES as usize];259 for row in 0..SAMPLES {260 let v = -1.0 + 2.0 * row as f32 / (SAMPLES - 1) as f32;261 let z = height_fn(u, v);262 px[row as usize] = 0.50 + 0.34 * (u - v);263 py[row as usize] = 0.58 - 0.16 * (u + v) - 0.23 * z;264 }265 let t = col as f32 / (LINES - 1) as f32;266 let mut col_style = line(gradient(far, near, t), "", 1.15, 8);267 col_style.color.a = 0.78;268 ax.plot_xy(&px, &py, col_style);269 }270 ax.title(title);271 ax.limits(-0.20, 1.20, 0.02, 1.08);272 ax.grid(false);273 ax.legend(false);274}275276fn loss_landscape(ax: &mut Axes) {277 wireframe(278 ax,279 "projected loss landscape",280 |x, y| {281 let bowl = 0.42 * (x * x + 0.75 * y * y);282 bowl + 0.18 * (2.7 * x).sin() * (3.1 * y).cos()283 },284 cyan(),285 purple(),286 );287}288289fn gradient_basin(ax: &mut Axes) {290 wireframe(291 ax,292 "projected optimizer basin",293 |x, y| {294 let radius = (x * x + y * y).sqrt();295 0.34 * radius + 0.17 * (9.0 * radius).cos() * (-1.8 * radius).exp()296 },297 success(),298 warning(),299 );300}301302fn gallery(theme: Theme) -> oa::plot::Figure {303 let mut fig = oa::plot::Figure::new(FigureConfig {304 title: "OA Plot gallery".to_owned(),305 rows: 3,306 cols: 3,307 width: 1600,308 height: 1050,309 h_spacing: 32,310 v_spacing: 36,311 padding: 34,312 theme,313 ..Default::default()314 });315 fig.title("OA Plot — GPU-composed ML diagnostics");316 training_plot(fig.ax(0, 0));317 roc_plot(fig.ax(0, 1));318 precision_recall_plot(fig.ax(0, 2));319 score_histogram(fig.ax(1, 0));320 calibration_scatter(fig.ax(1, 1));321 throughput_bars(fig.ax(1, 2));322 confusion_heatmap(fig.ax(2, 0));323 loss_landscape(fig.ax(2, 1));324 gradient_basin(fig.ax(2, 2));325 fig326}327328fn evaluation_figure() -> oa::plot::Figure {329 let mut fig = oa::plot::Figure::new(FigureConfig {330 title: "OA model evaluation".to_owned(),331 rows: 1,332 cols: 2,333 width: 1280,334 height: 560,335 h_spacing: 36,336 padding: 34,337 ..Default::default()338 });339 fig.title("Model evaluation — ROC and precision-recall");340 roc_plot(fig.ax(0, 0));341 precision_recall_plot(fig.ax(0, 1));342 fig343}344345fn diagnostics_figure() -> oa::plot::Figure {346 let mut fig = oa::plot::Figure::new(FigureConfig {347 title: "OA model diagnostics".to_owned(),348 rows: 2,349 cols: 2,350 width: 1200,351 height: 900,352 h_spacing: 32,353 v_spacing: 36,354 padding: 34,355 ..Default::default()356 });357 fig.title("training and evaluation diagnostics");358 training_plot(fig.ax(0, 0));359 score_histogram(fig.ax(0, 1));360 calibration_scatter(fig.ax(1, 0));361 confusion_heatmap(fig.ax(1, 1));362 fig363}364365fn landscapes_figure() -> oa::plot::Figure {366 let mut fig = oa::plot::Figure::new(FigureConfig {367 title: "OA projected landscapes".to_owned(),368 rows: 1,369 cols: 2,370 width: 1280,371 height: 560,372 h_spacing: 36,373 padding: 34,374 ..Default::default()375 });376 fig.title("scalar-field projections — explicit-X wireframes");377 loss_landscape(fig.ax(0, 0));378 gradient_basin(fig.ax(0, 1));379 fig380}381382// ── Entry point ───────────────────────────────────────────────────────────────383384fn usage(program: &str) {385 eprintln!("usage: {program} [--output DIR] [--headless]");386}387388fn main() -> anyhow::Result<()> {389 let mut output = std::path::PathBuf::from("artifact/plot");390 let mut show = true;391392 let args: Vec<String> = std::env::args().collect();393 let mut i = 1;394 while i < args.len() {395 match args[i].as_str() {396 "--headless" => {397 show = false;398 }399 "--output" if i + 1 < args.len() => {400 i += 1;401 output = std::path::PathBuf::from(&args[i]);402 }403 "--help" => {404 usage(&args[0]);405 return Ok(());406 }407 other => {408 eprintln!("unknown argument: {other}");409 usage(&args[0]);410 std::process::exit(1);411 }412 }413 i += 1;414 }415416 std::fs::create_dir_all(&output).map_err(|e| {417 eprintln!("could not create output dir: {e}");418 e419 })?;420421 let engine = if show {422 let window = oa::SdlWindow::new("OA Plot presentation probe", 1, 1)?;423 let extensions = window.required_instance_extensions()?;424 Engine::builder().instance_extensions(extensions).build()?425 } else {426 Engine::new()?427 };428429 let mut dark = gallery(Theme::Dark);430 let mut light = gallery(Theme::Light);431 let mut intro = intro_figure();432 let mut evaluation = evaluation_figure();433 let mut diagnostics = diagnostics_figure();434 let mut landscapes = landscapes_figure();435436 println!("OA Plot walkthrough artifacts:");437438 let save = |fig: &mut oa::plot::Figure, name: &str| -> anyhow::Result<()> {439 let path = output.join(name);440 fig.save_to(&engine, path.to_str().unwrap_or(name))?;441 println!(" {}", path.display());442 Ok(())443 };444445 save(&mut intro, "oa-plot-intro-dark.png")?;446 save(&mut dark, "oa-plot-gallery-dark.png")?;447 save(&mut light, "oa-plot-gallery-light.png")?;448 save(&mut evaluation, "oa-plot-evaluation-dark.png")?;449 save(&mut diagnostics, "oa-plot-diagnostics-dark.png")?;450 save(&mut landscapes, "oa-plot-landscapes-dark.png")?;451452 if show {453 dark.show(&engine)?;454 }455 Ok(())456}457
Present
These earlier gallery renders illustrate dark and light diagnostics, evaluation curves, training layouts, and scalar-field landscapes. They retain their original presentation provenance and are not new Rust render evidence.
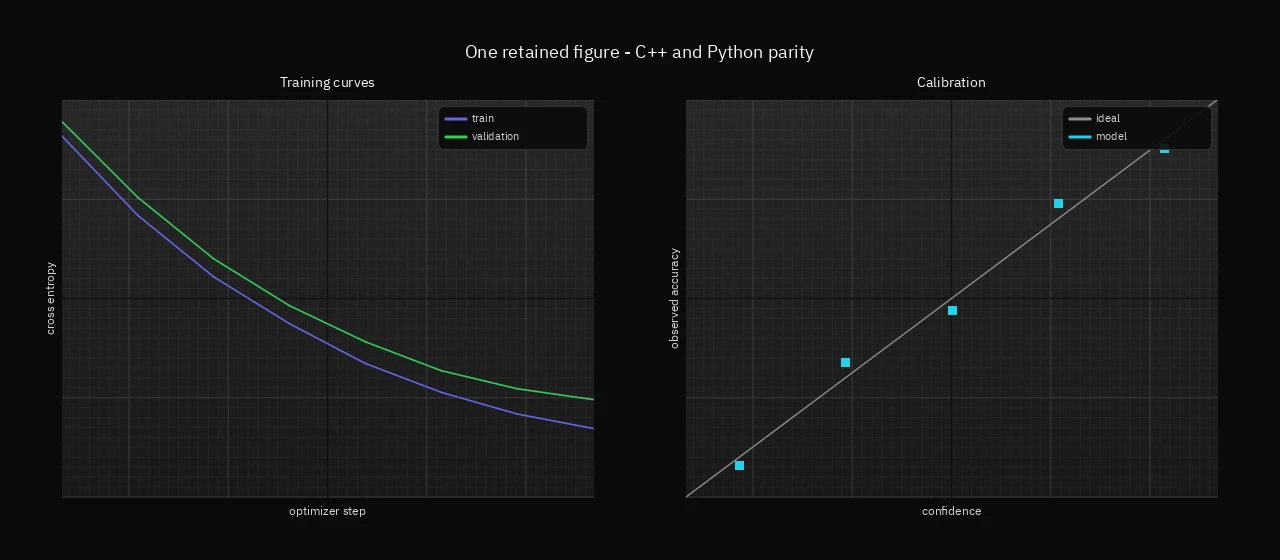
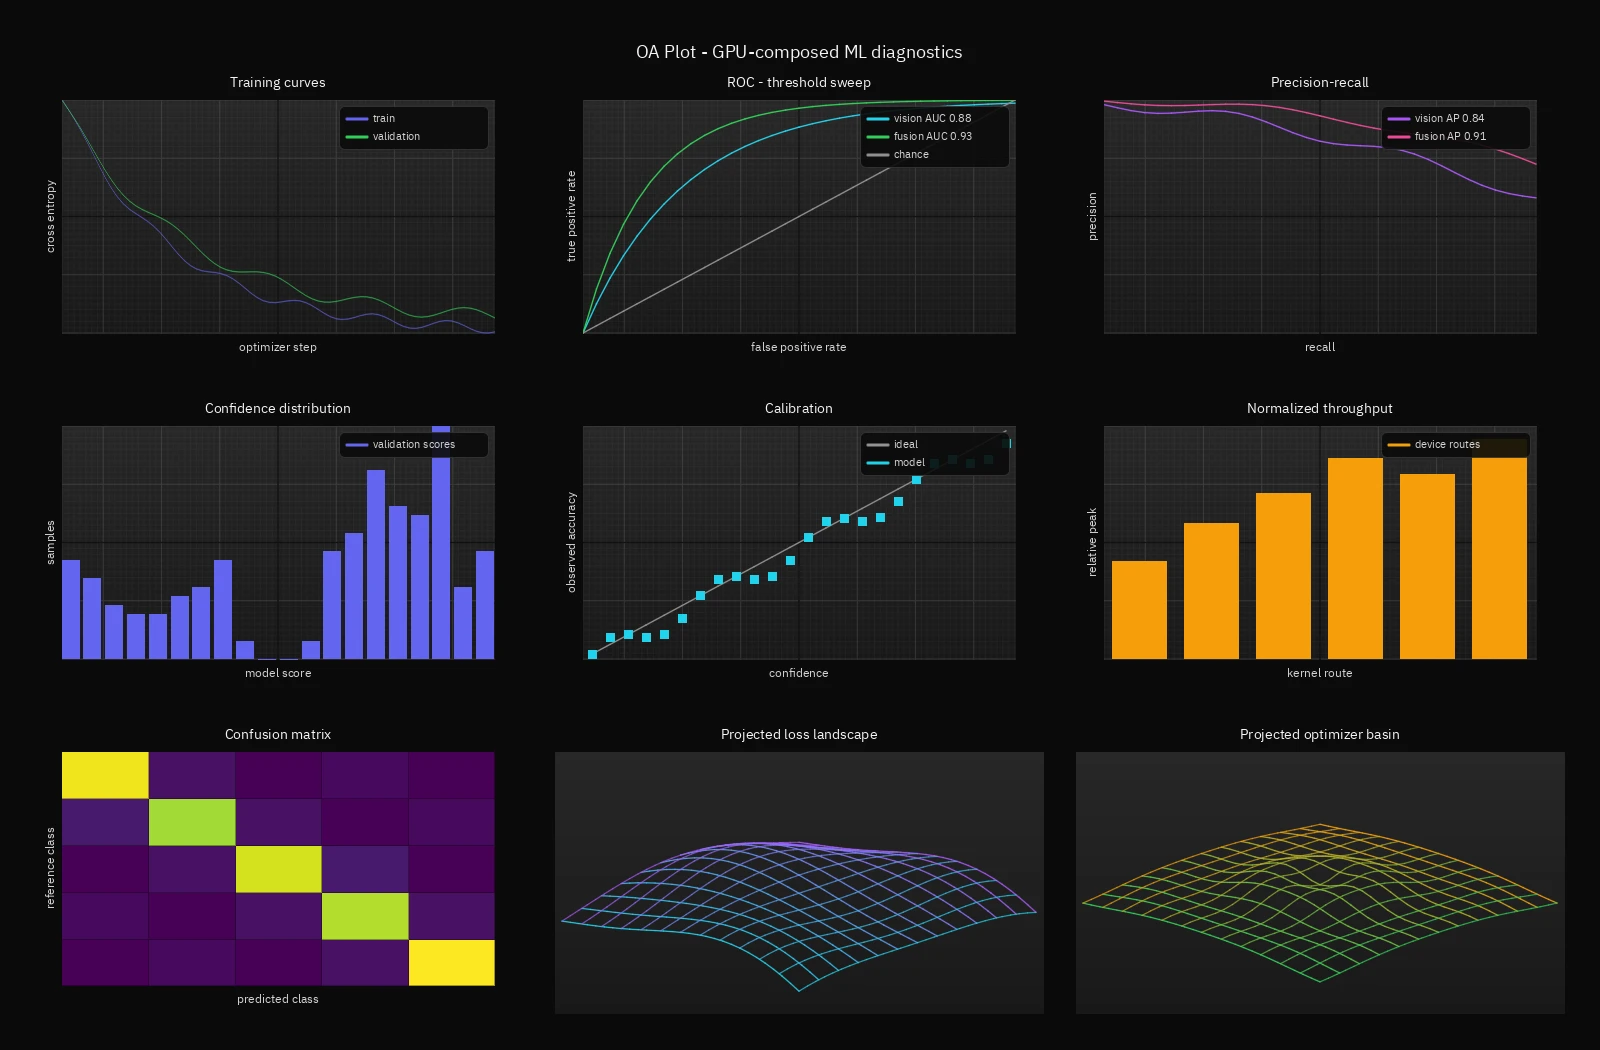
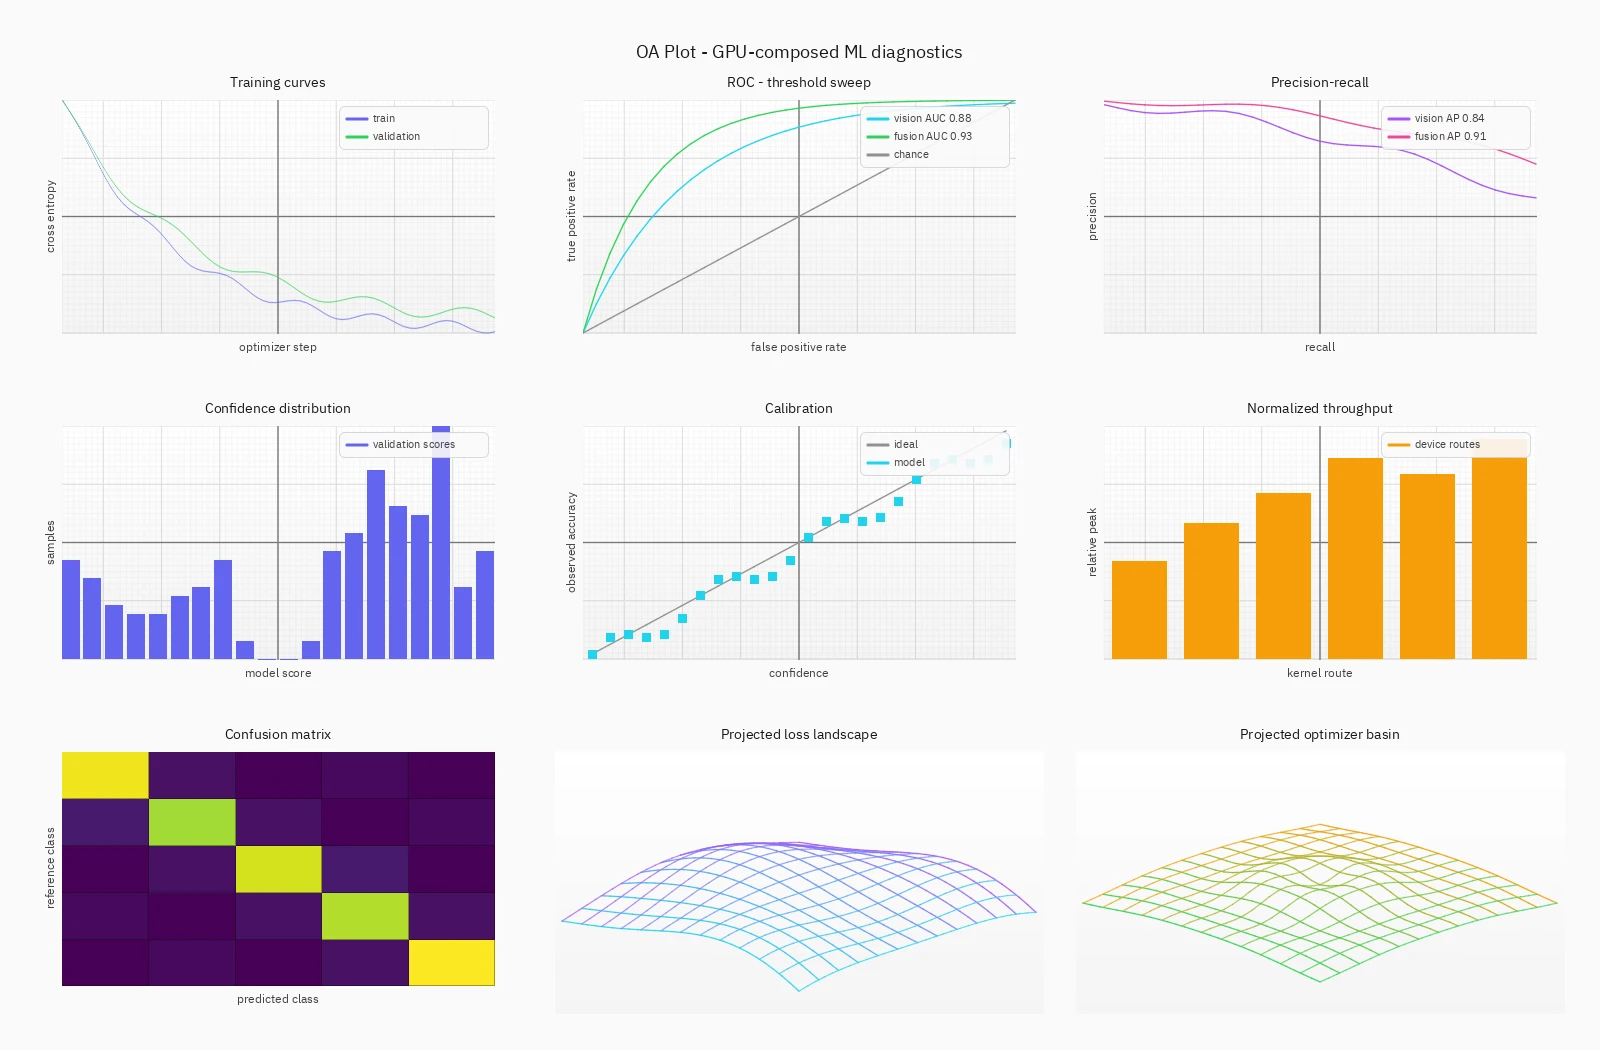
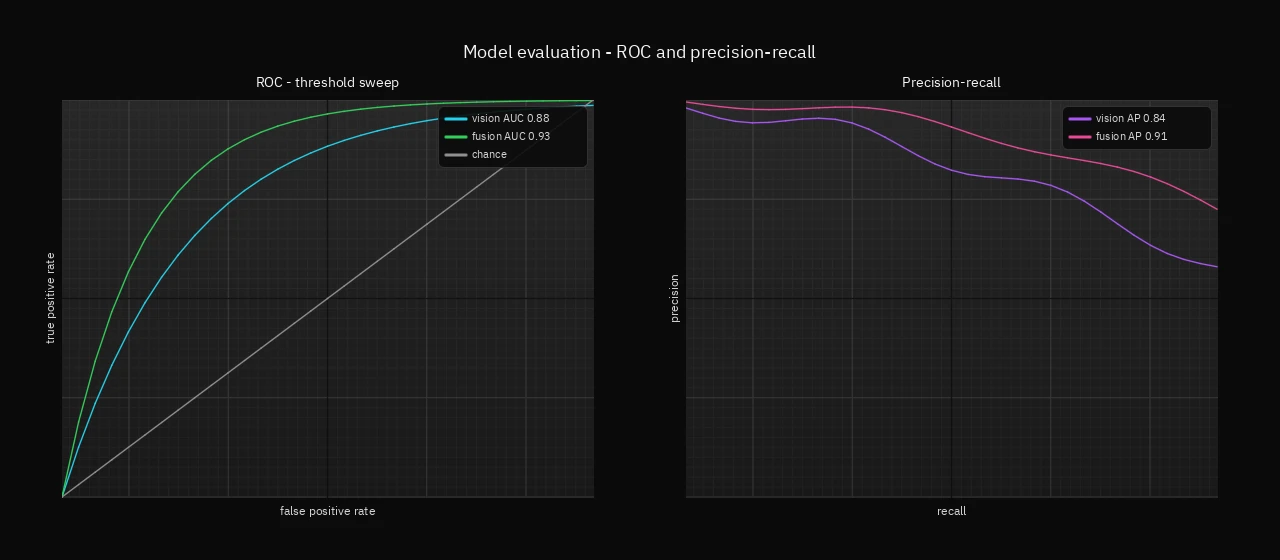
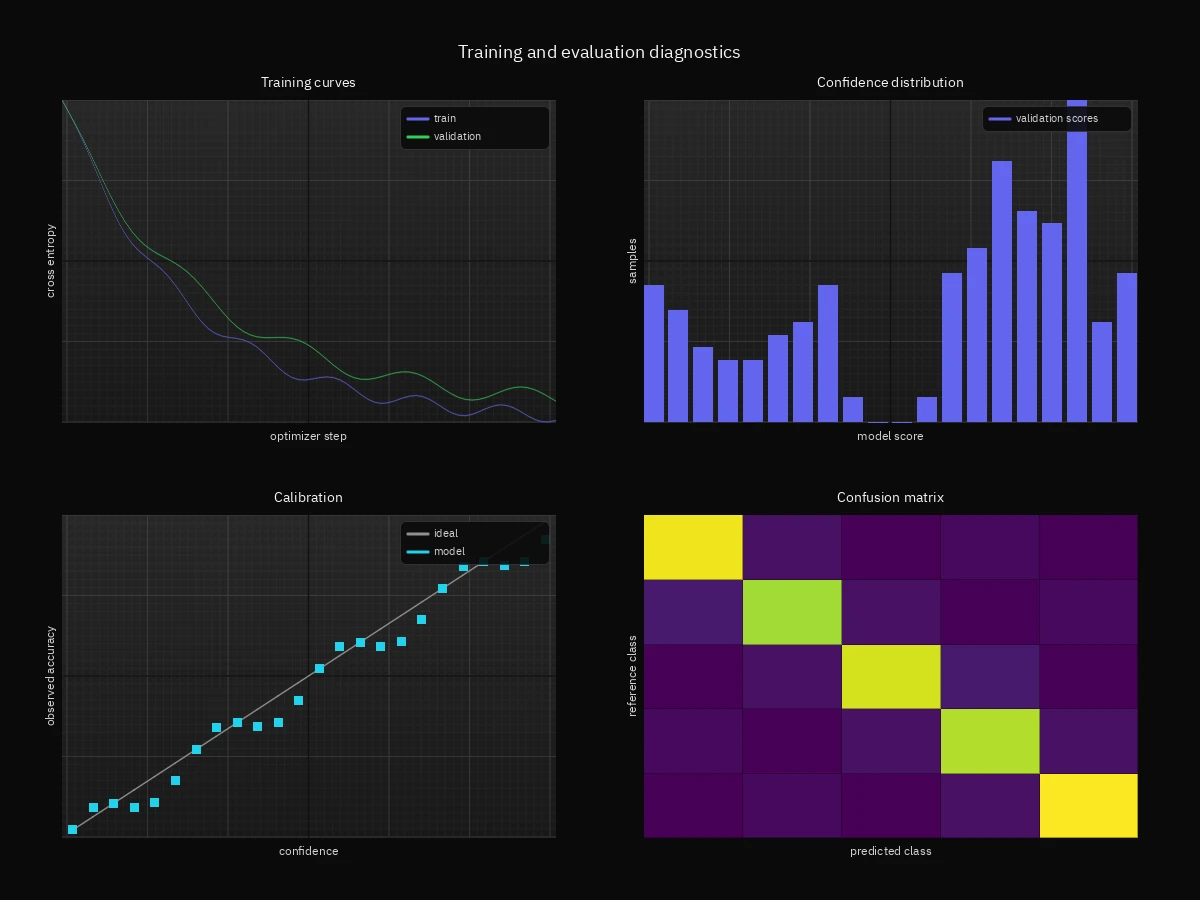
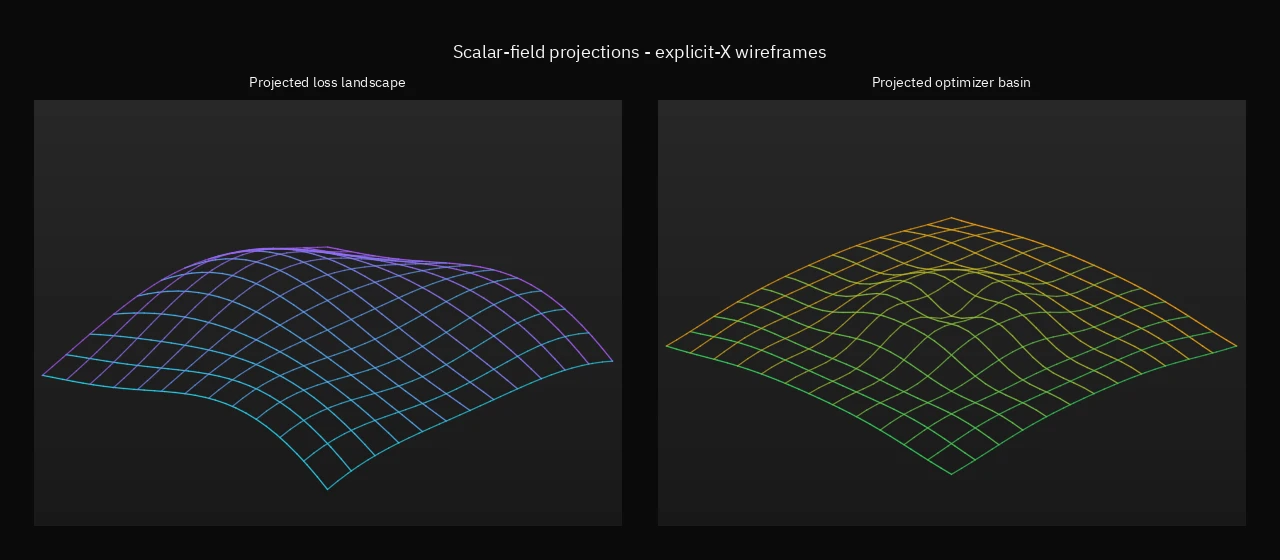
Six generated OA Plot examples