Ui & Plot
Vulkan-native presentation without a second graphics framework.
OA Ui is the retained command layer over oa::render::Renderer. oa::Viewer presents images and video interactively; oa::plot builds composable figures and renders the same result to a semantic oa::Image for display, documentation, or headless automation.
Rust · PythonGPU compositorInteractive + headless
One renderer, semantic front ends
oa::render::Renderer
The low-level Vulkan rendering service. Ui and Plot submit retained draw commands to it; there is no separate Ui renderer.
oa::Viewer
Interactive image and video presentation with playback, scrubbing, live-source updates, and a headless path for automated runs.
oa::plot
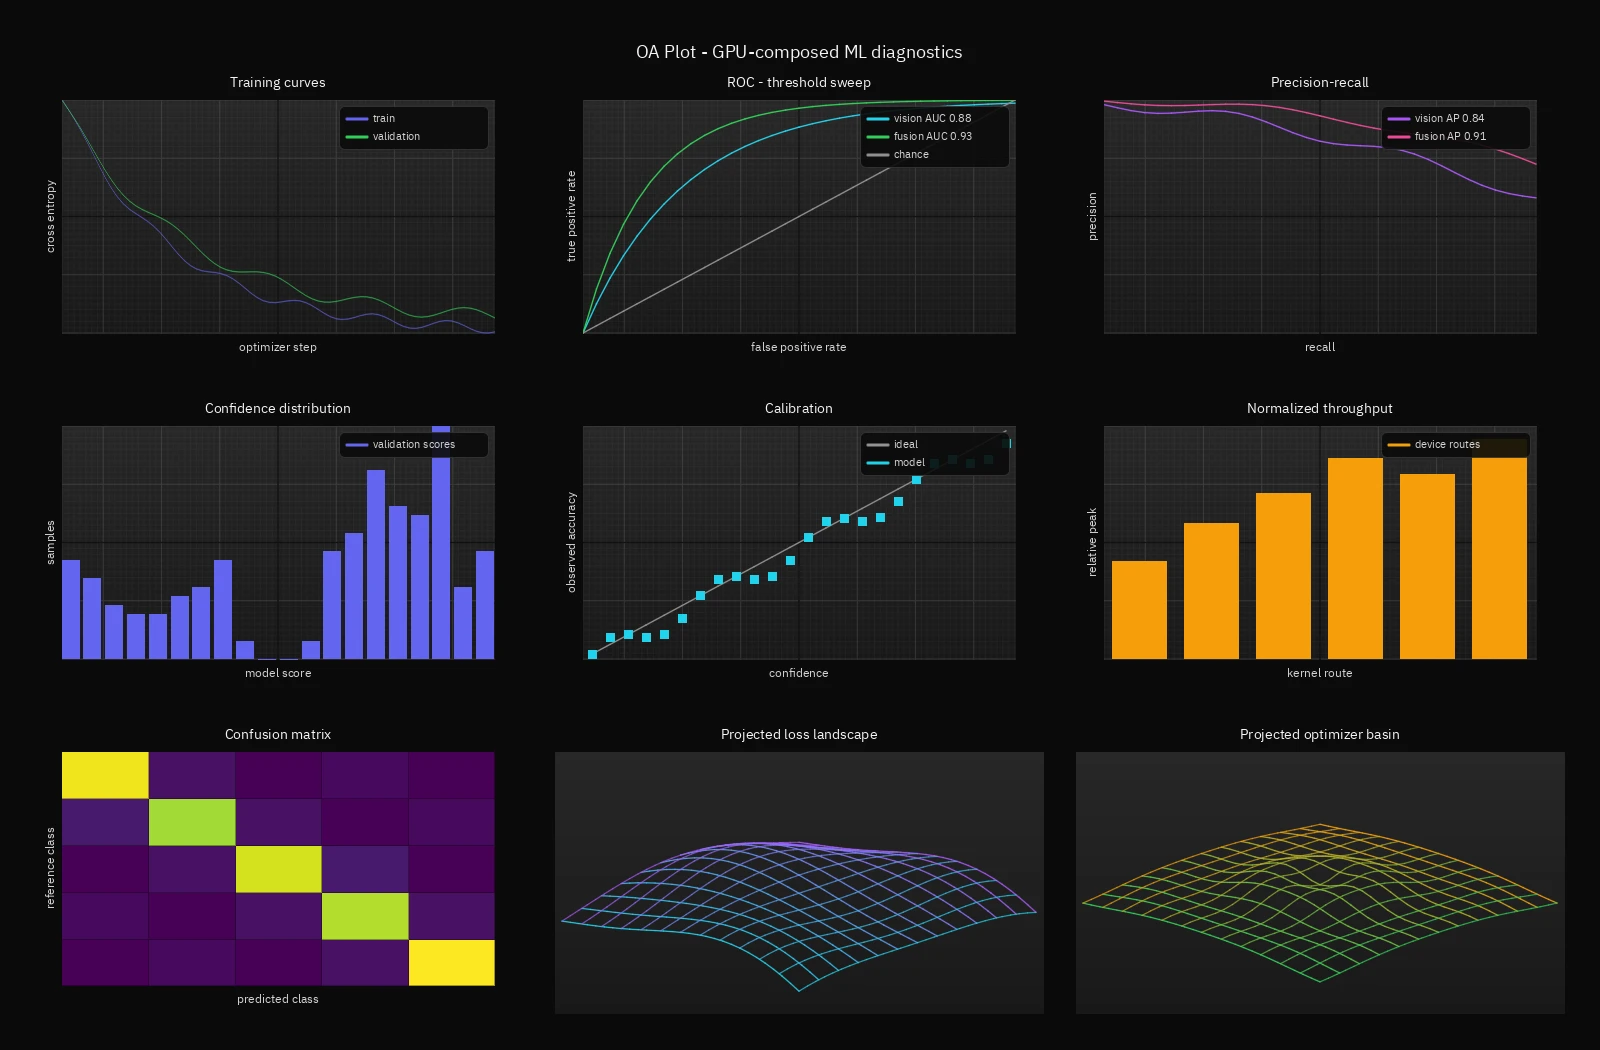
Figures, axes, lines, scatter, bars, histograms, heatmaps, legends, labels, themes, and projected scalar-field wireframes.
oa::Image output
Figure::render produces a semantic RGBA image. save_to and show are presentation choices over the same retained figure.
Retained figures in Rust and Python
This source is extracted during documentation generation from the paired executable current gallery tutorials. The screenshots below retain the earlier gallery presentation; they are not new Rust render evidence.
1use std::f32::consts::PI;23use oa::plot::{Axes, BarStyle, FigureConfig, HeatmapStyle, LineStyle, ScatterStyle, Theme};4use oa::{Color, Engine};56// ── Style helpers ─────────────────────────────────────────────────────────────78fn line(color: Color, label: &str, width: f32, antialias_samples: u32) -> LineStyle {9 LineStyle {10 color,11 label: label.to_owned(),12 width,13 antialias_samples,14 }15}1617fn points(color: Color, label: &str, radius: f32) -> ScatterStyle {18 ScatterStyle {19 color,20 label: label.to_owned(),21 radius,22 }23}2425fn bars(color: Color, label: &str, gap: f32) -> BarStyle {26 BarStyle {27 color,28 label: label.to_owned(),29 gap,30 }31}3233fn gradient(a: Color, b: Color, t: f32) -> Color {34 let t = t.clamp(0.0, 1.0);35 Color::new(36 a.r + (b.r - a.r) * t,37 a.g + (b.g - a.g) * t,38 a.b + (b.b - a.b) * t,39 a.a + (b.a - a.a) * t,40 )41}4243// ── Named colors matching the donor palette ───────────────────────────────────4445fn accent() -> Color {46 Color::new(0.24, 0.65, 1.00, 1.0)47}48fn success() -> Color {49 Color::new(0.35, 0.82, 0.54, 1.0)50}51fn purple() -> Color {52 Color::new(0.75, 0.45, 1.00, 1.0)53}54fn cyan() -> Color {55 Color::new(0.30, 0.87, 0.89, 1.0)56}57fn warning() -> Color {58 Color::new(1.00, 0.80, 0.22, 1.0)59}60fn pink() -> Color {61 Color::new(1.00, 0.55, 0.75, 1.0)62}63fn gray() -> Color {64 Color::new(0.565, 0.565, 0.565, 1.0)65}6667// ── Individual axes builders ──────────────────────────────────────────────────6869// [oa-plot-intro-begin]70fn intro_figure() -> oa::plot::Figure {71 let mut fig = oa::plot::Figure::new(FigureConfig {72 title: "oa::plot intro".to_owned(),73 rows: 1,74 cols: 2,75 width: 1280,76 height: 560,77 h_spacing: 36,78 padding: 34,79 theme: Theme::Dark,80 ..Default::default()81 });82 fig.title("One retained figure — Rust and C++ parity");8384 let steps = [0.0f32, 1.0, 2.0, 3.0, 4.0, 5.0, 6.0, 7.0];85 let train = [1.00f32, 0.78, 0.61, 0.48, 0.37, 0.29, 0.23, 0.19];86 let validation = [1.04f32, 0.83, 0.66, 0.53, 0.43, 0.35, 0.30, 0.27];87 let ideal = [0.0f32, 0.25, 0.50, 0.75, 1.0];88 let confidence = [0.10f32, 0.30, 0.50, 0.70, 0.90];89 let accuracy = [0.08f32, 0.34, 0.47, 0.74, 0.88];9091 let curves = fig.ax(0, 0);92 curves.title("training curves");93 curves.x_label("optimizer step");94 curves.y_label("cross entropy");95 curves.limits(0.0, 7.0, 0.0, 1.1);96 curves.plot_xy(&steps, &train, line(accent(), "train", 1.6, 4));97 curves.plot_xy(&steps, &validation, line(success(), "validation", 1.6, 4));9899 let quality = fig.ax(0, 1);100 quality.title("Calibration");101 quality.x_label("confidence");102 quality.y_label("observed accuracy");103 quality.limits(0.0, 1.0, 0.0, 1.0);104 quality.plot_xy(&ideal, &ideal, line(gray(), "ideal", 1.35, 4));105 quality.scatter(&confidence, &accuracy, points(cyan(), "model", 3.5));106 fig107}108// [oa-plot-intro-end]109110fn training_plot(ax: &mut Axes) {111 let n = 72usize;112 let train: Vec<f32> = (0..n)113 .map(|i| {114 let step = i as f32;115 1.55 * (-step / 18.0).exp() + 0.035 * (step * 0.52).sin() + 0.11116 })117 .collect();118 let validation: Vec<f32> = (0..n)119 .map(|i| {120 let step = i as f32;121 1.45 * (-step / 21.0).exp() + 0.045 * (step * 0.39 + 0.8).sin() + 0.17122 })123 .collect();124 ax.title("training curves");125 ax.x_label("optimizer step");126 ax.y_label("cross entropy");127 ax.plot(&train, line(accent(), "train", 1.35, 4));128 ax.plot(&validation, line(success(), "validation", 1.35, 4));129}130131fn roc_plot(ax: &mut Axes) {132 let n = 33usize;133 let rate: Vec<f32> = (0..n).map(|i| i as f32 / (n - 1) as f32).collect();134 let vision: Vec<f32> = rate135 .iter()136 .map(|&x| (1.0 - (-4.3 * x).exp()).clamp(0.0, 1.0))137 .collect();138 let fusion: Vec<f32> = rate139 .iter()140 .map(|&x| (1.0 - (-6.7 * x).exp()).clamp(0.0, 1.0))141 .collect();142 ax.title("ROC — threshold sweep");143 ax.x_label("false positive rate");144 ax.y_label("true positive rate");145 ax.limits(0.0, 1.0, 0.0, 1.0);146 ax.plot_xy(&rate, &vision, line(cyan(), "vision AUC 0.88", 1.35, 4));147 ax.plot_xy(&rate, &fusion, line(success(), "fusion AUC 0.93", 1.35, 4));148 ax.plot_xy(&rate, &rate, line(gray(), "chance", 1.35, 4));149}150151fn precision_recall_plot(ax: &mut Axes) {152 let n = 33usize;153 let recall: Vec<f32> = (0..n).map(|i| i as f32 / (n - 1) as f32).collect();154 let vision: Vec<f32> = recall155 .iter()156 .map(|&x| (0.98 - 0.40 * x.powf(1.6) - 0.025 * (x * 5.0 * PI).sin()).clamp(0.0, 1.0))157 .collect();158 let fusion: Vec<f32> = recall159 .iter()160 .map(|&x| (0.995 - 0.27 * x.powf(2.1) - 0.015 * (x * 4.0 * PI).sin()).clamp(0.0, 1.0))161 .collect();162 ax.title("Precision-recall");163 ax.x_label("recall");164 ax.y_label("precision");165 ax.limits(0.0, 1.0, 0.0, 1.0);166 ax.plot_xy(&recall, &vision, line(purple(), "vision AP 0.84", 1.35, 4));167 ax.plot_xy(&recall, &fusion, line(pink(), "fusion AP 0.91", 1.35, 4));168}169170fn score_histogram(ax: &mut Axes) {171 let scores: Vec<f32> = (0..192usize)172 .map(|i| {173 let phase = i as f32;174 let cluster = if i % 3 == 0 { 0.28 } else { 0.74 };175 (cluster + 0.12 * (phase * 1.73).sin() + 0.045 * (phase * 0.37).cos()).clamp(0.0, 1.0)176 })177 .collect();178 ax.title("confidence distribution");179 ax.x_label("model score");180 ax.y_label("samples");181 ax.histogram(&scores, 20, bars(accent(), "validation scores", 0.20));182}183184fn calibration_scatter(ax: &mut Axes) {185 let n = 24usize;186 let confidence: Vec<f32> = (0..n).map(|i| (i as f32 + 0.5) / n as f32).collect();187 let accuracy: Vec<f32> = confidence188 .iter()189 .map(|&x| (x + 0.055 * (8.0 * PI * x).sin() - 0.025).clamp(0.0, 1.0))190 .collect();191 let ideal: Vec<f32> = confidence.clone();192 ax.title("Calibration");193 ax.x_label("confidence");194 ax.y_label("observed accuracy");195 ax.limits(0.0, 1.0, 0.0, 1.0);196 ax.plot_xy(&confidence, &ideal, line(gray(), "ideal", 1.35, 4));197 ax.scatter(&confidence, &accuracy, points(cyan(), "model", 3.5));198}199200fn throughput_bars(ax: &mut Axes) {201 let throughput = [0.42f32, 0.58, 0.71, 0.86, 0.79, 0.94];202 ax.title("normalized throughput");203 ax.x_label("kernel route");204 ax.y_label("relative peak");205 ax.limits(-0.5, 5.5, 0.0, 1.0);206 ax.bar(&throughput, bars(warning(), "device routes", 0.24));207}208209fn confusion_heatmap(ax: &mut Axes) {210 let confusion = [211 42.0f32, 2.0, 0.0, 1.0, 0.0, 3.0, 37.0, 2.0, 0.0, 1.0, 0.0, 2.0, 40.0, 3.0, 0.0, 1.0, 0.0, 2.0,212 38.0, 2.0, 0.0, 1.0, 0.0, 2.0, 43.0,213 ];214 ax.title("confusion matrix");215 ax.x_label("predicted class");216 ax.y_label("reference class");217 ax.heatmap(218 &confusion,219 5,220 5,221 HeatmapStyle {222 colormap: 1,223 auto_scale: true,224 show_grid: true,225 ..Default::default()226 },227 );228 ax.grid(false);229}230231fn wireframe(232 ax: &mut Axes,233 title: &str,234 height_fn: impl Fn(f32, f32) -> f32,235 near: Color,236 far: Color,237) {238 const LINES: i32 = 13;239 const SAMPLES: i32 = 29;240 // Row sweeps.241 for row in 0..LINES {242 let v = -1.0 + 2.0 * row as f32 / (LINES - 1) as f32;243 let mut px = vec![0.0f32; SAMPLES as usize];244 let mut py = vec![0.0f32; SAMPLES as usize];245 for col in 0..SAMPLES {246 let u = -1.0 + 2.0 * col as f32 / (SAMPLES - 1) as f32;247 let z = height_fn(u, v);248 px[col as usize] = 0.50 + 0.34 * (u - v);249 py[col as usize] = 0.58 - 0.16 * (u + v) - 0.23 * z;250 }251 let t = row as f32 / (LINES - 1) as f32;252 ax.plot_xy(&px, &py, line(gradient(far, near, t), "", 1.15, 8));253 }254 // Column sweeps.255 for col in 0..LINES {256 let u = -1.0 + 2.0 * col as f32 / (LINES - 1) as f32;257 let mut px = vec![0.0f32; SAMPLES as usize];258 let mut py = vec![0.0f32; SAMPLES as usize];259 for row in 0..SAMPLES {260 let v = -1.0 + 2.0 * row as f32 / (SAMPLES - 1) as f32;261 let z = height_fn(u, v);262 px[row as usize] = 0.50 + 0.34 * (u - v);263 py[row as usize] = 0.58 - 0.16 * (u + v) - 0.23 * z;264 }265 let t = col as f32 / (LINES - 1) as f32;266 let mut col_style = line(gradient(far, near, t), "", 1.15, 8);267 col_style.color.a = 0.78;268 ax.plot_xy(&px, &py, col_style);269 }270 ax.title(title);271 ax.limits(-0.20, 1.20, 0.02, 1.08);272 ax.grid(false);273 ax.legend(false);274}275276fn loss_landscape(ax: &mut Axes) {277 wireframe(278 ax,279 "projected loss landscape",280 |x, y| {281 let bowl = 0.42 * (x * x + 0.75 * y * y);282 bowl + 0.18 * (2.7 * x).sin() * (3.1 * y).cos()283 },284 cyan(),285 purple(),286 );287}288289fn gradient_basin(ax: &mut Axes) {290 wireframe(291 ax,292 "projected optimizer basin",293 |x, y| {294 let radius = (x * x + y * y).sqrt();295 0.34 * radius + 0.17 * (9.0 * radius).cos() * (-1.8 * radius).exp()296 },297 success(),298 warning(),299 );300}301302fn gallery(theme: Theme) -> oa::plot::Figure {303 let mut fig = oa::plot::Figure::new(FigureConfig {304 title: "OA Plot gallery".to_owned(),305 rows: 3,306 cols: 3,307 width: 1600,308 height: 1050,309 h_spacing: 32,310 v_spacing: 36,311 padding: 34,312 theme,313 ..Default::default()314 });315 fig.title("OA Plot — GPU-composed ML diagnostics");316 training_plot(fig.ax(0, 0));317 roc_plot(fig.ax(0, 1));318 precision_recall_plot(fig.ax(0, 2));319 score_histogram(fig.ax(1, 0));320 calibration_scatter(fig.ax(1, 1));321 throughput_bars(fig.ax(1, 2));322 confusion_heatmap(fig.ax(2, 0));323 loss_landscape(fig.ax(2, 1));324 gradient_basin(fig.ax(2, 2));325 fig326}327328fn evaluation_figure() -> oa::plot::Figure {329 let mut fig = oa::plot::Figure::new(FigureConfig {330 title: "OA model evaluation".to_owned(),331 rows: 1,332 cols: 2,333 width: 1280,334 height: 560,335 h_spacing: 36,336 padding: 34,337 ..Default::default()338 });339 fig.title("Model evaluation — ROC and precision-recall");340 roc_plot(fig.ax(0, 0));341 precision_recall_plot(fig.ax(0, 1));342 fig343}344345fn diagnostics_figure() -> oa::plot::Figure {346 let mut fig = oa::plot::Figure::new(FigureConfig {347 title: "OA model diagnostics".to_owned(),348 rows: 2,349 cols: 2,350 width: 1200,351 height: 900,352 h_spacing: 32,353 v_spacing: 36,354 padding: 34,355 ..Default::default()356 });357 fig.title("training and evaluation diagnostics");358 training_plot(fig.ax(0, 0));359 score_histogram(fig.ax(0, 1));360 calibration_scatter(fig.ax(1, 0));361 confusion_heatmap(fig.ax(1, 1));362 fig363}364365fn landscapes_figure() -> oa::plot::Figure {366 let mut fig = oa::plot::Figure::new(FigureConfig {367 title: "OA projected landscapes".to_owned(),368 rows: 1,369 cols: 2,370 width: 1280,371 height: 560,372 h_spacing: 36,373 padding: 34,374 ..Default::default()375 });376 fig.title("scalar-field projections — explicit-X wireframes");377 loss_landscape(fig.ax(0, 0));378 gradient_basin(fig.ax(0, 1));379 fig380}381382// ── Entry point ───────────────────────────────────────────────────────────────383384fn usage(program: &str) {385 eprintln!("usage: {program} [--output DIR] [--headless]");386}387388fn main() -> anyhow::Result<()> {389 let mut output = std::path::PathBuf::from("artifact/plot");390 let mut show = true;391392 let args: Vec<String> = std::env::args().collect();393 let mut i = 1;394 while i < args.len() {395 match args[i].as_str() {396 "--headless" => {397 show = false;398 }399 "--output" if i + 1 < args.len() => {400 i += 1;401 output = std::path::PathBuf::from(&args[i]);402 }403 "--help" => {404 usage(&args[0]);405 return Ok(());406 }407 other => {408 eprintln!("unknown argument: {other}");409 usage(&args[0]);410 std::process::exit(1);411 }412 }413 i += 1;414 }415416 std::fs::create_dir_all(&output).map_err(|e| {417 eprintln!("could not create output dir: {e}");418 e419 })?;420421 let engine = if show {422 let window = oa::SdlWindow::new("OA Plot presentation probe", 1, 1)?;423 let extensions = window.required_instance_extensions()?;424 Engine::builder().instance_extensions(extensions).build()?425 } else {426 Engine::new()?427 };428429 let mut dark = gallery(Theme::Dark);430 let mut light = gallery(Theme::Light);431 let mut intro = intro_figure();432 let mut evaluation = evaluation_figure();433 let mut diagnostics = diagnostics_figure();434 let mut landscapes = landscapes_figure();435436 println!("OA Plot walkthrough artifacts:");437438 let save = |fig: &mut oa::plot::Figure, name: &str| -> anyhow::Result<()> {439 let path = output.join(name);440 fig.save_to(&engine, path.to_str().unwrap_or(name))?;441 println!(" {}", path.display());442 Ok(())443 };444445 save(&mut intro, "oa-plot-intro-dark.png")?;446 save(&mut dark, "oa-plot-gallery-dark.png")?;447 save(&mut light, "oa-plot-gallery-light.png")?;448 save(&mut evaluation, "oa-plot-evaluation-dark.png")?;449 save(&mut diagnostics, "oa-plot-diagnostics-dark.png")?;450 save(&mut landscapes, "oa-plot-landscapes-dark.png")?;451452 if show {453 dark.show(&engine)?;454 }455 Ok(())456}457
Current surface
| Layer | Contract |
|---|---|
| Figure | Fixed output size, theme, grid layout, spacing, padding, labels, render, save_to, and show |
| Axes | plot, scatter, bar, histogram, heatmap, imshow, limits, grid, legend, title, labels, caption, and border color |
| Line quality | Per-line 1×, 2×, 4×, or 8× antialias sampling; unsupported requests resolve deterministically |
| Execution | Retained CPU-side description lowered to GPU draw and compute work through the process engine |